


Market Movers Weekly
Our Team's Top Day Trading Setups

Welcome to this week's edition of "Market Movers Weekly," where we dive into the most promising day trading setups in the stock market. Our focus this week is on TSLA, PTON, META, and SPY, each presenting unique opportunities based on recent technical analysis and market trends.
TSLA 0.00%↑
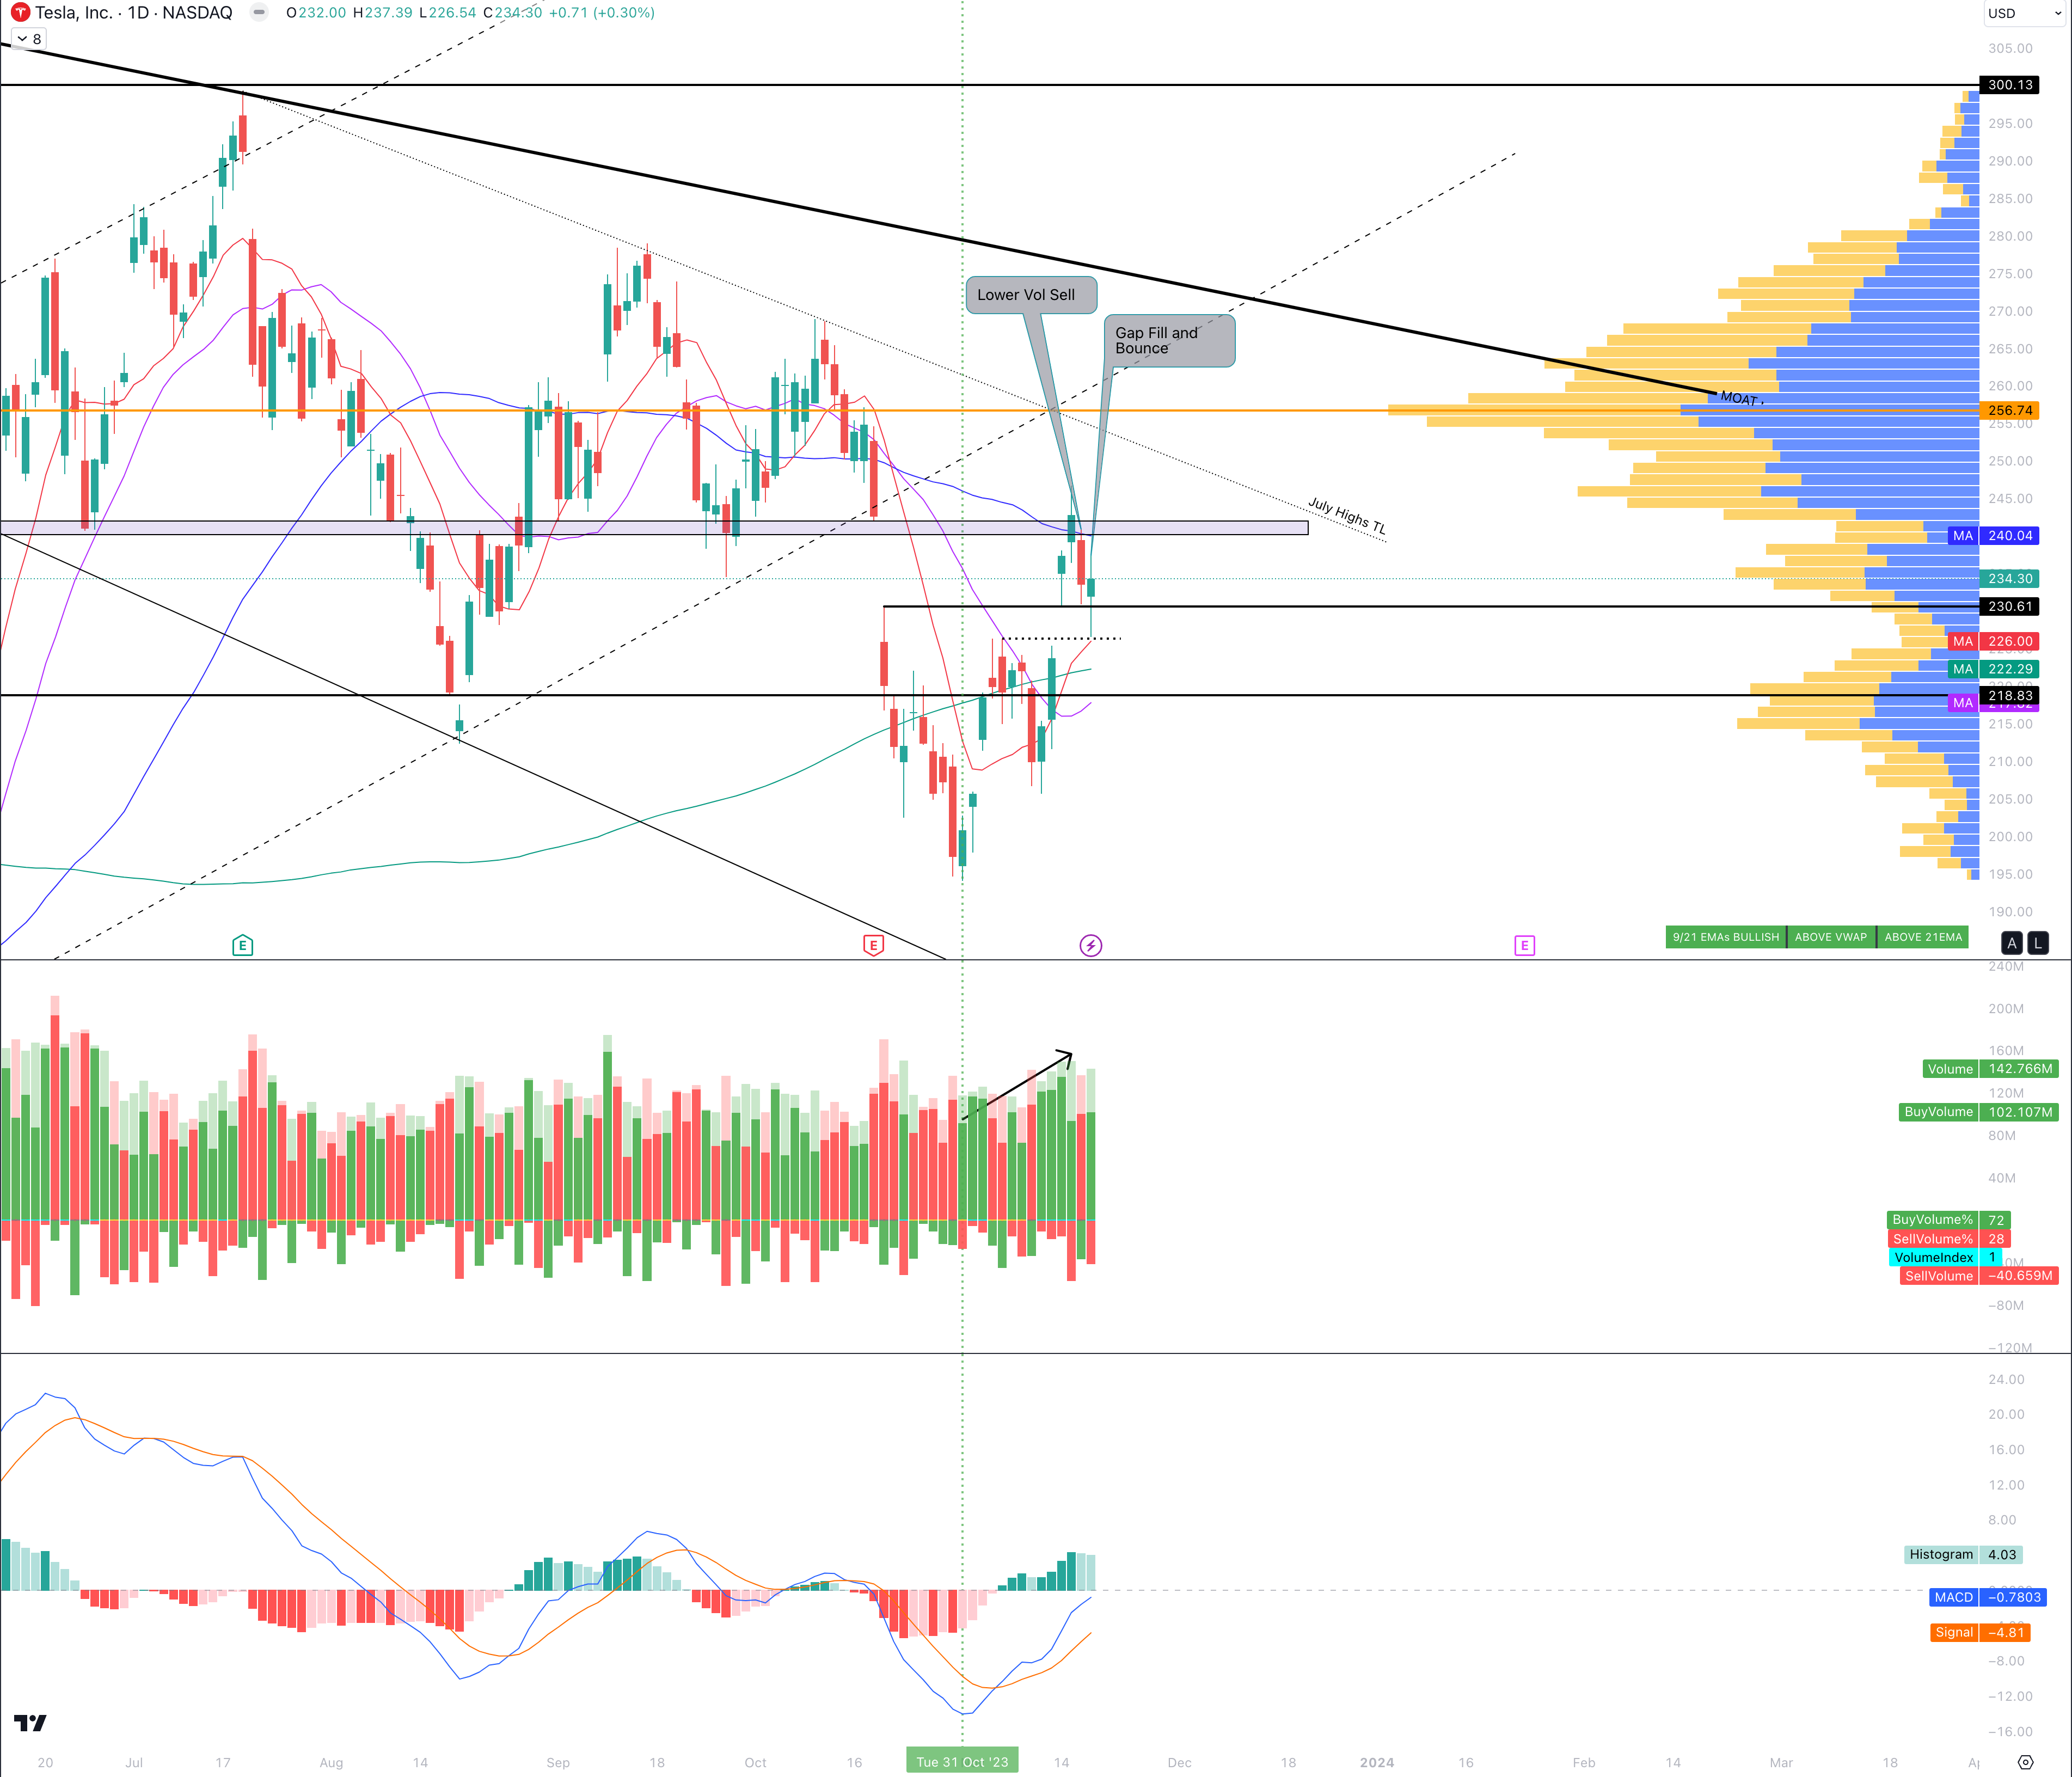
Current Trend: Bullish run since October 31st, characterized by increasing buying volume.
Recent Price Action: Experienced a lower volume sell-off, followed by a bullish rebound off its 10-day moving average.
Technical Outlook: Remains bullish with an immediate price target range of $240-$242, a critical supply/demand zone. A further retest of the channel trend line above $250 is anticipated.
Key Catalysts: The anticipated launch of the CyberTruck on November 30 and rumors about a wider release of FSD v12, which employs advanced AI neural networks.
PTON 0.00%↑

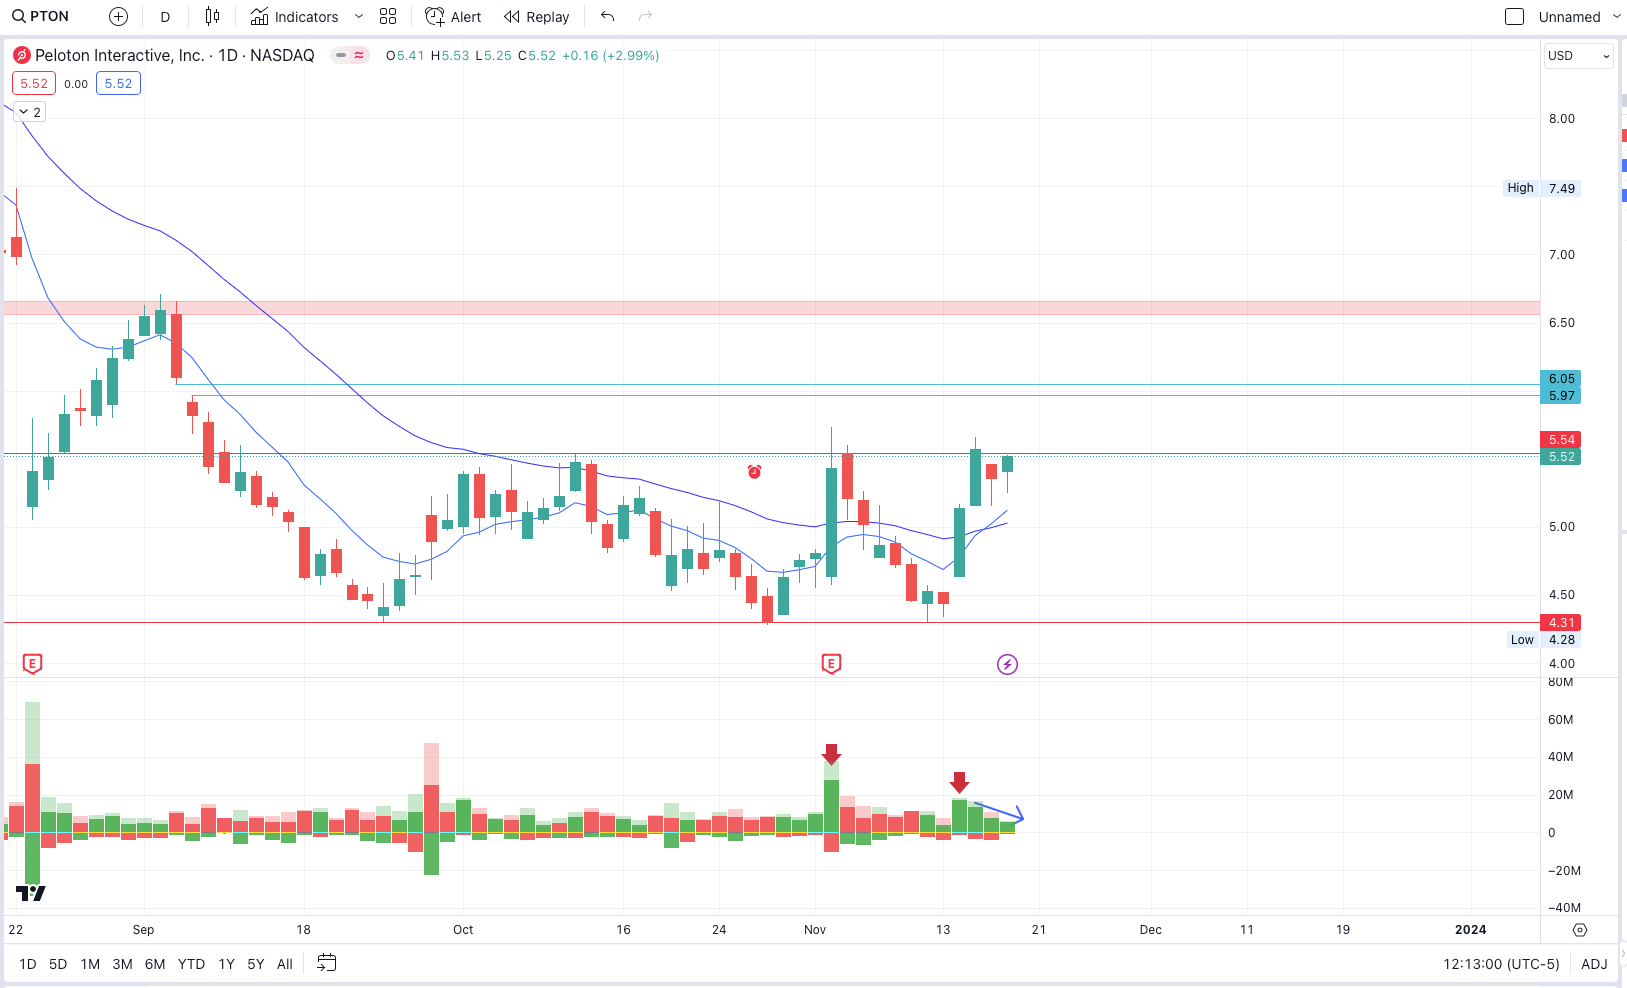
Weekly Chart: Demonstrates a bullish engulfing pattern and a tweezer bottom formation from all-time lows.
Daily Chart: Currently oscillating within a clear range between $4.31 and $5.54, showing signs of a bull flag pattern.
Hourly Chart: Indicates a cup and handle formation, with an inverted head and shoulders pattern as the handle. The volume is increasing on upward movements, which is a bullish sign.
Trade Strategy: Watch for a strong breakout above the $5.54 range. Potential targets include $5.97, $6.05, and the more significant daily supply zone between $6.56 and $6.66.
ELEVATE YOUR TRADING: Join the Spyder Academy Community
Ready to embark on an enriched trading journey? Spyder Academy beckons—a community nurtured by seven exceptional mentors. Test the waters with our 7-day free trial, and elevate your trading prowess with the best in the field.
META 0.00%↑
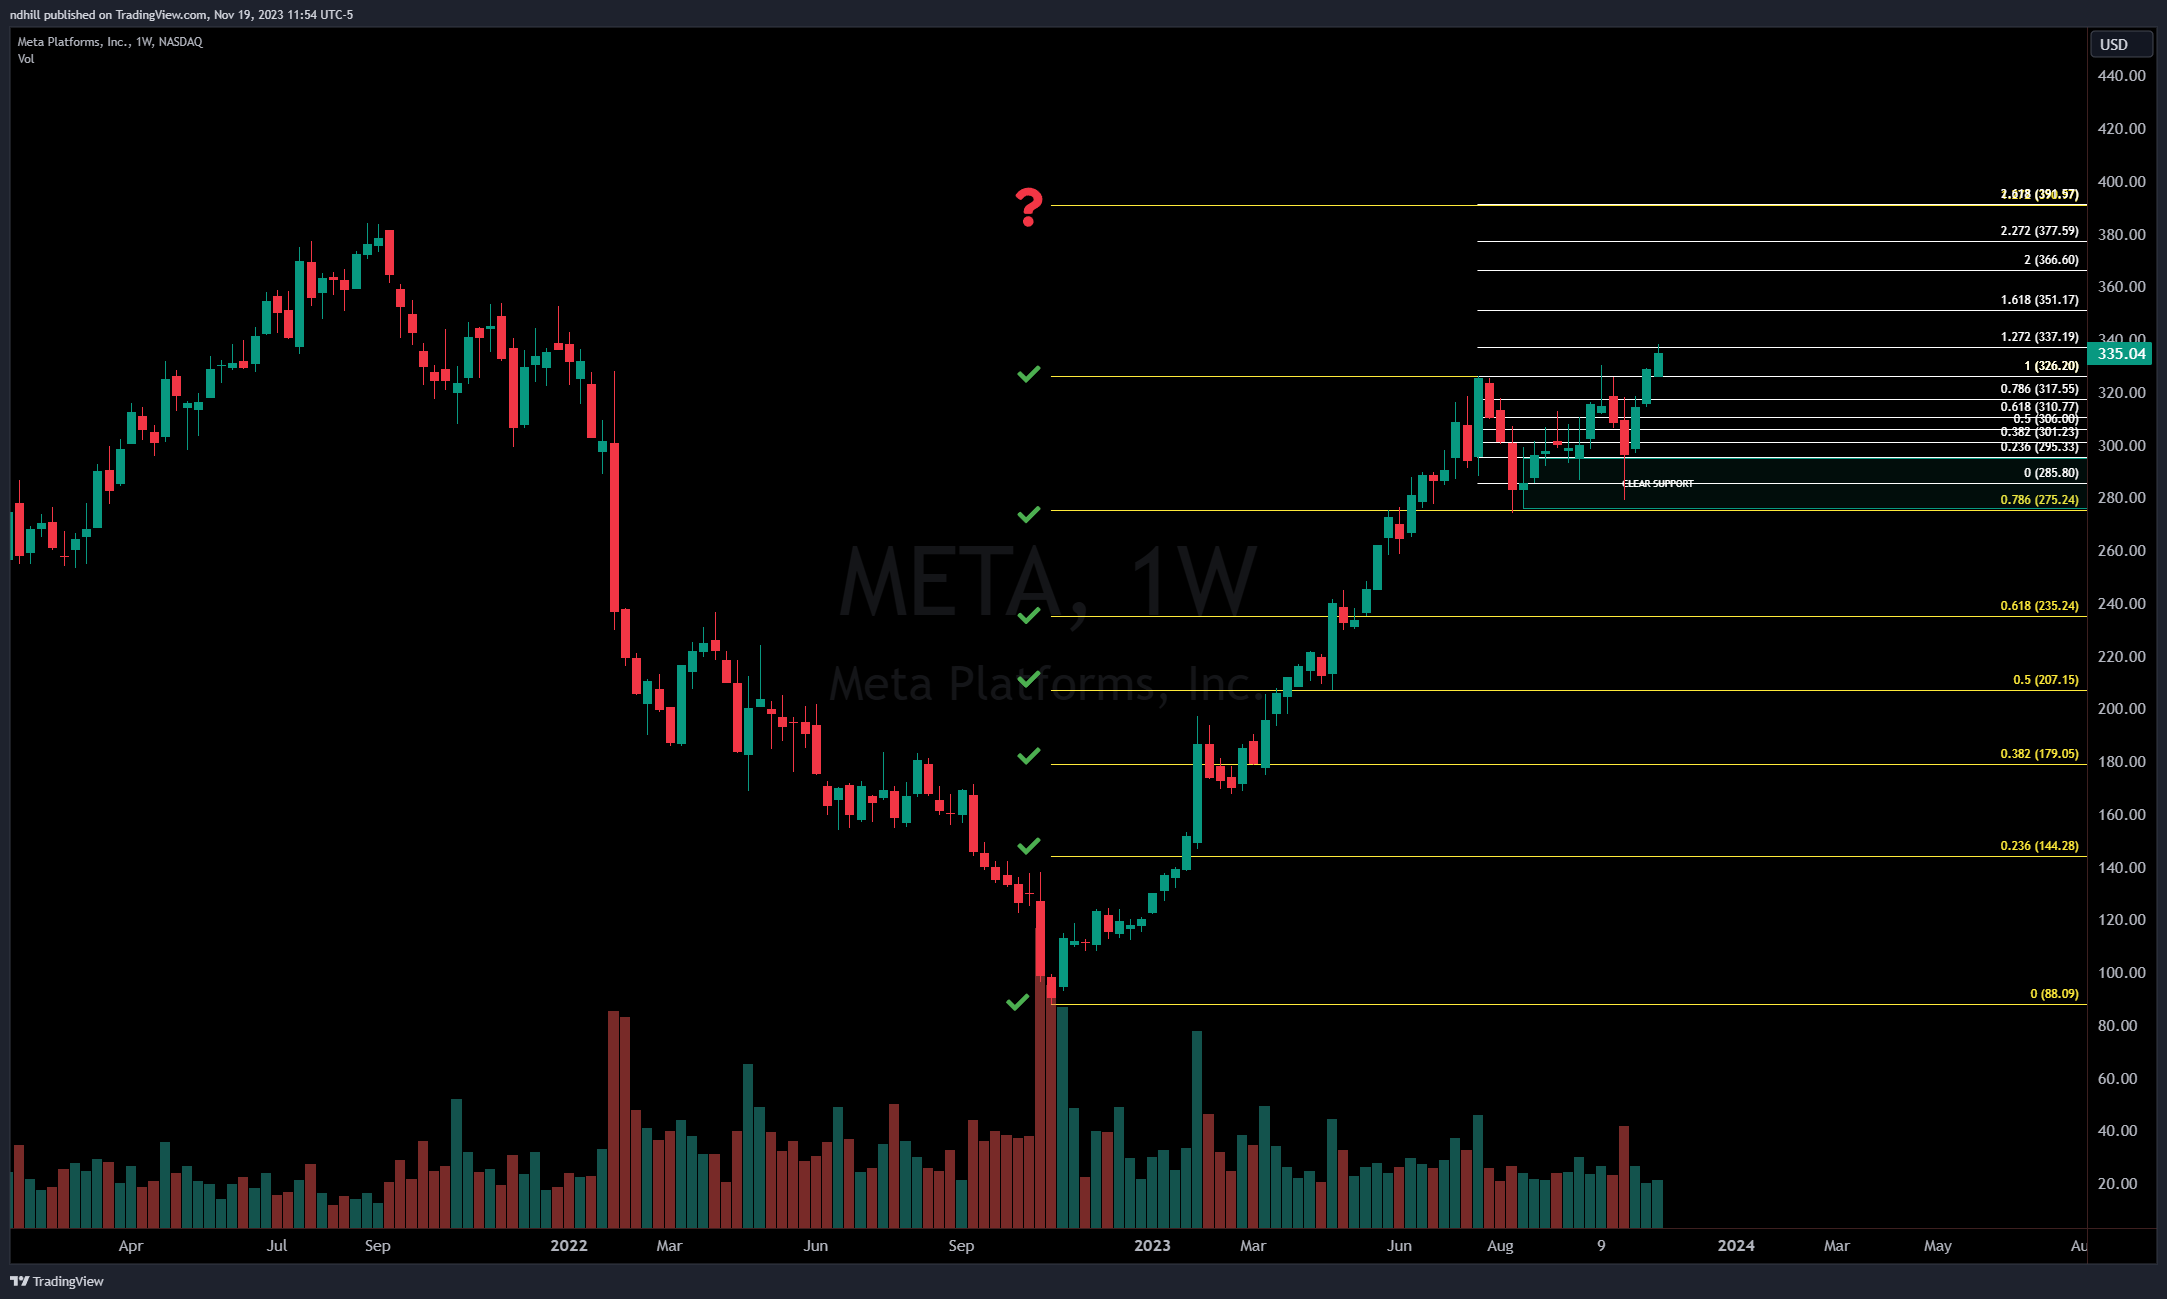

Recent Performance: Has been in a significant uptrend since late 2022, with a staggering 200% rise in 2023.
Current Position: Appears ready for a push towards all-time highs, having established new support at $326.20.
Next Levels: Targets include $338.30 and the crucial $350.00 mark, which was a key level in the last quarter of 2021.
Bearish Potential: A drop below $326 could open short opportunities back to the $318 - $320 range.
SPY 0.00%↑

Current Chart Analysis: The ETF is struggling to break out of the $450 range, pinned around the high GEX at 450, with volume showing little to no increase.
Bullish Scenario: A breakout over $451.08 could target $453.67 (July High) and then $459.44 (September High).
Bearish Perspective: A fall below $448 might target gap fills starting at $446.13, extending down to $441.28.
Holiday Week
It is a shorter holiday week this week with Thanksgiving on Thursday. We will also have a half-day on Friday, with the market closing at 1pm EST.
As we analyze these market setups, remember that day trading involves significant risk and requires an informed, strategic approach. Stay tuned to market movements, be prepared to adapt, and always perform your due diligence. Join us next week for more insights and analysis in "Market Movers Weekly." Until then, trade wisely and stay informed!
Disclaimer: This newsletter provides educational content, including opinions and analyses. It is not financial or investment advice. Neither Spyder Academy nor contributors are financial advisors. Trading and investing carry risks, and readers should conduct independent research or consult professionals before making decisions. Spyder Academy does not guarantee information accuracy or completeness, and is not liable for any losses incurred.